What do you get?
Contents
What do you get?#
Available Output Data Files#
Time series
Climotology files
Regridded (Climo) files
Transformed Eulerian Mean (TEM) files
Available Plots:#
Click on the image for a larger version
AMWG statistics tables#
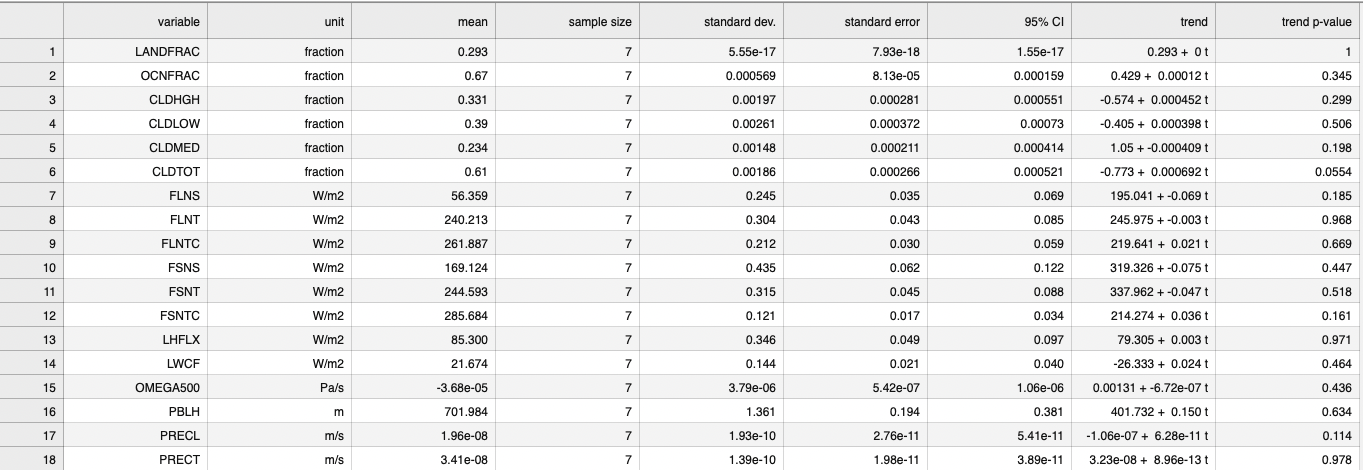
Fig. 1 Here is my figure caption!#
Global lat/lon plots#
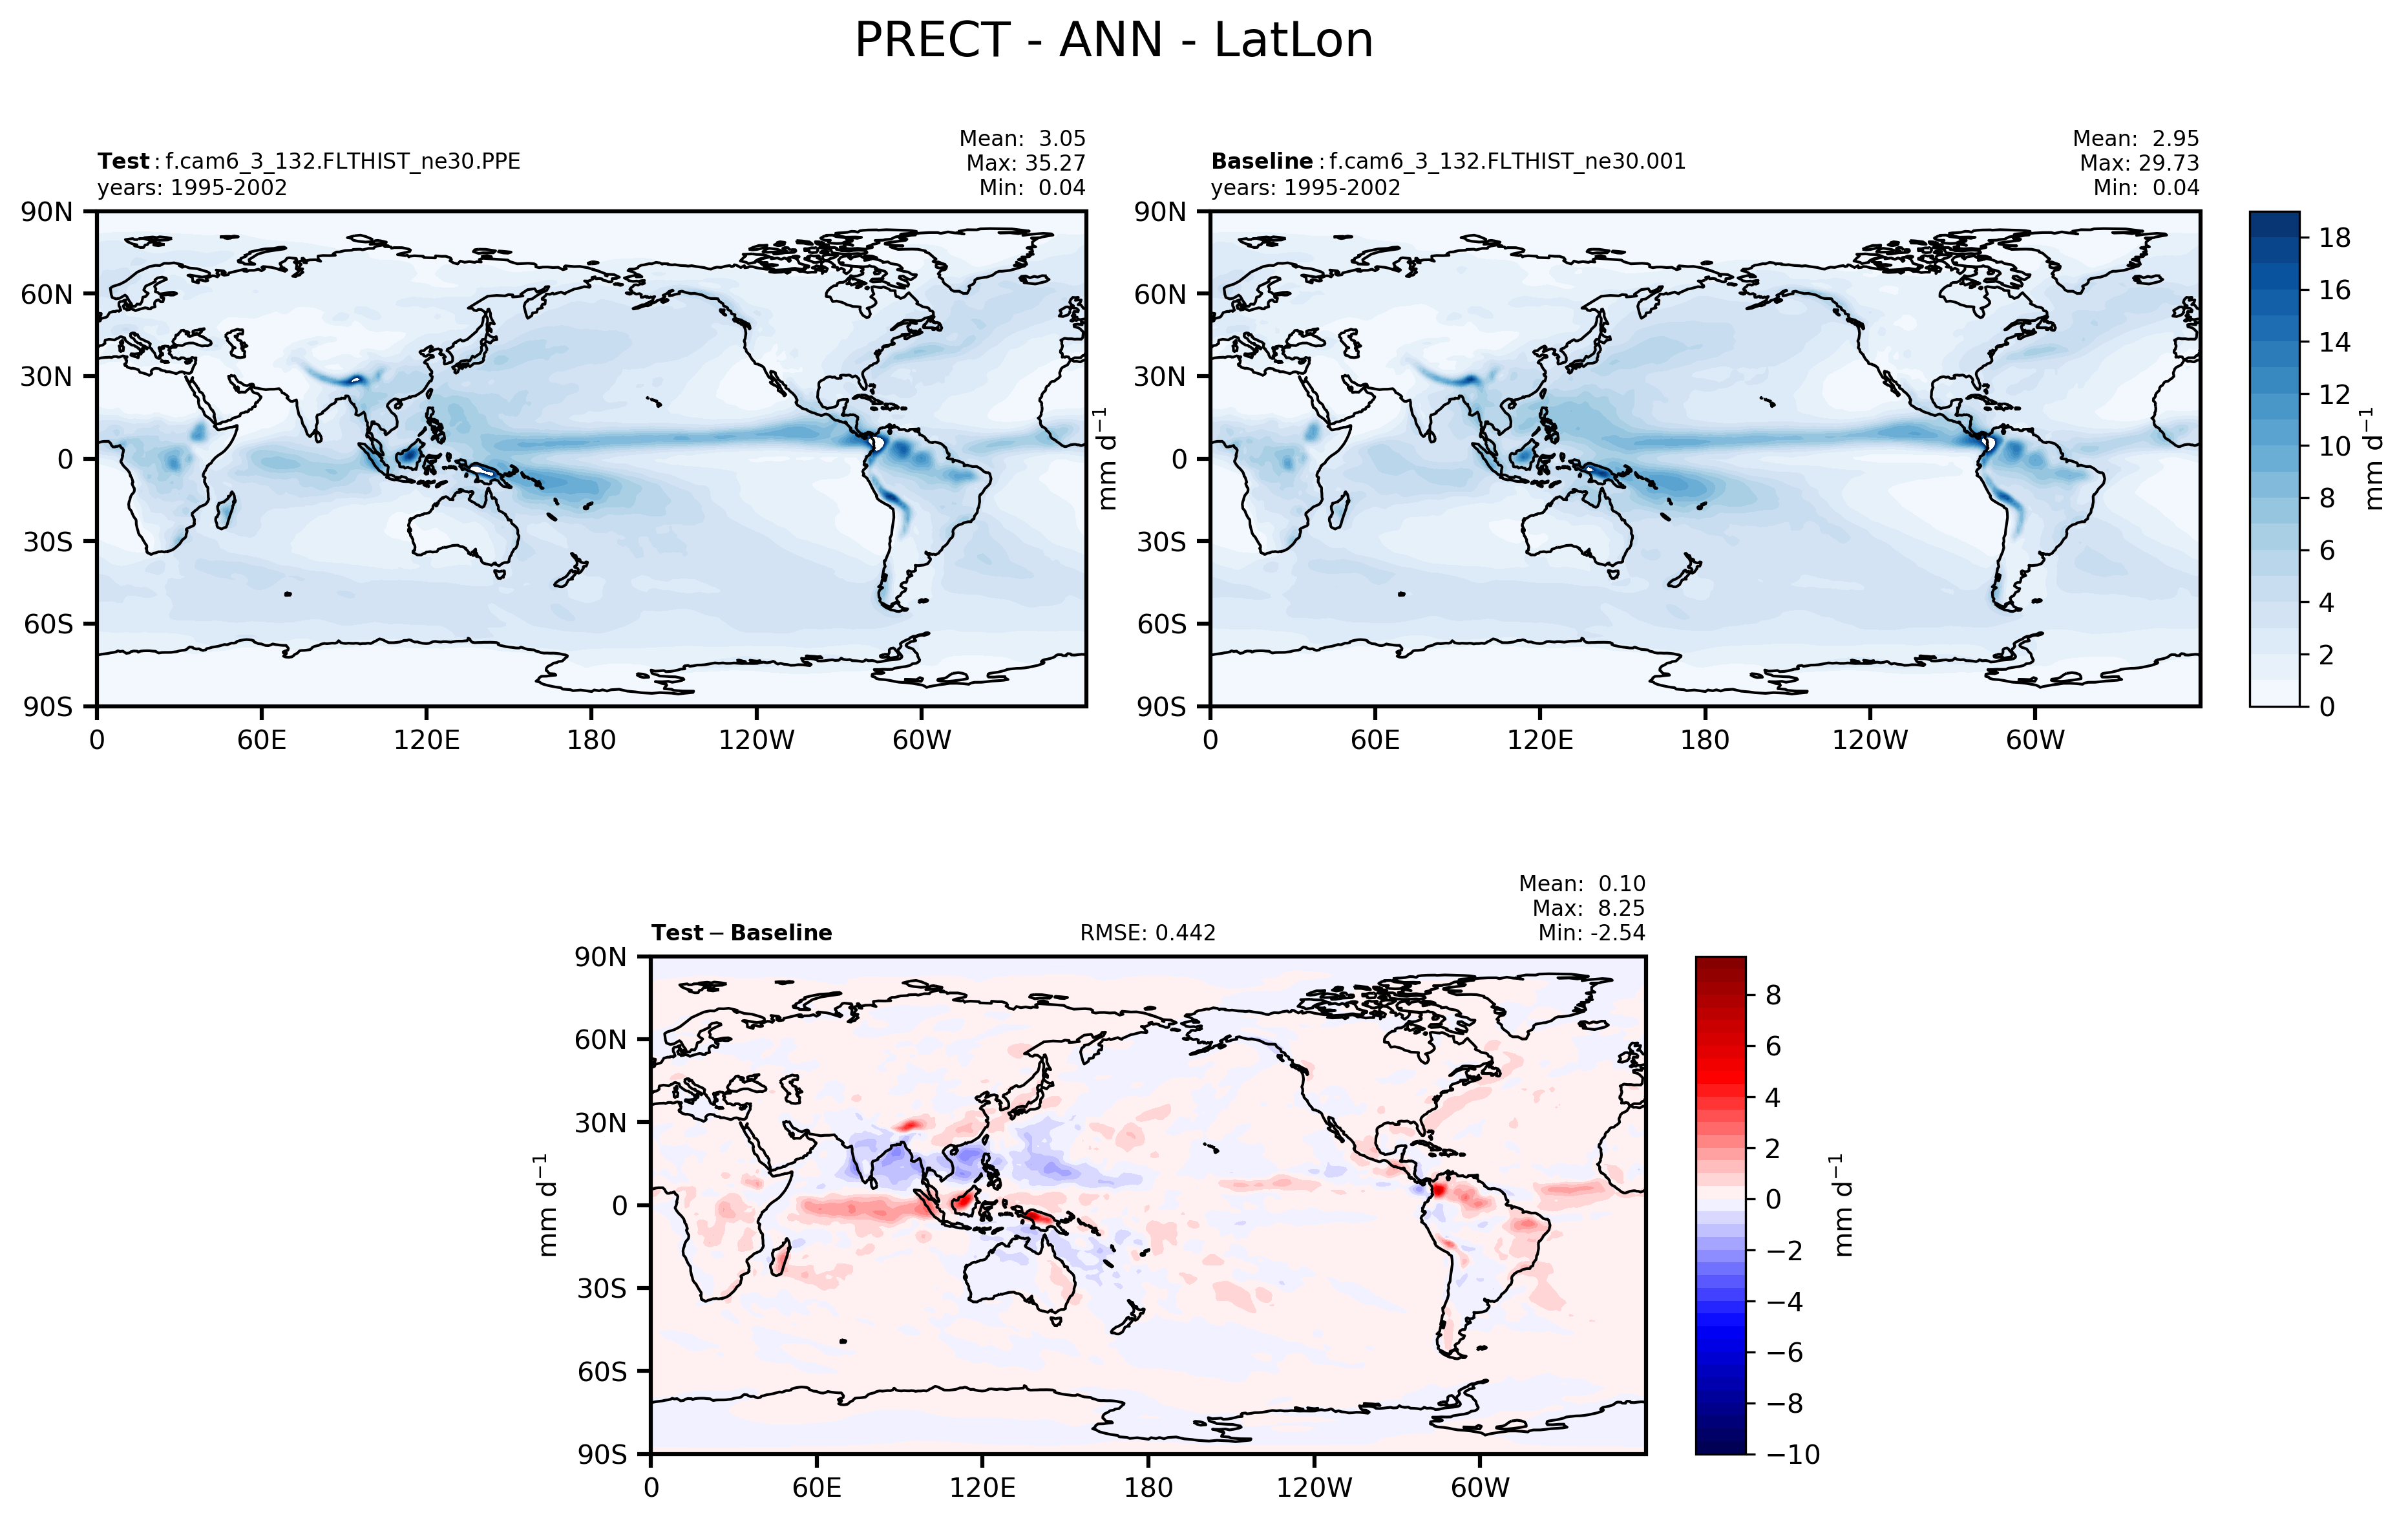
Fig. 2 Here is my figure caption!#
Global lat/lon vector plots#
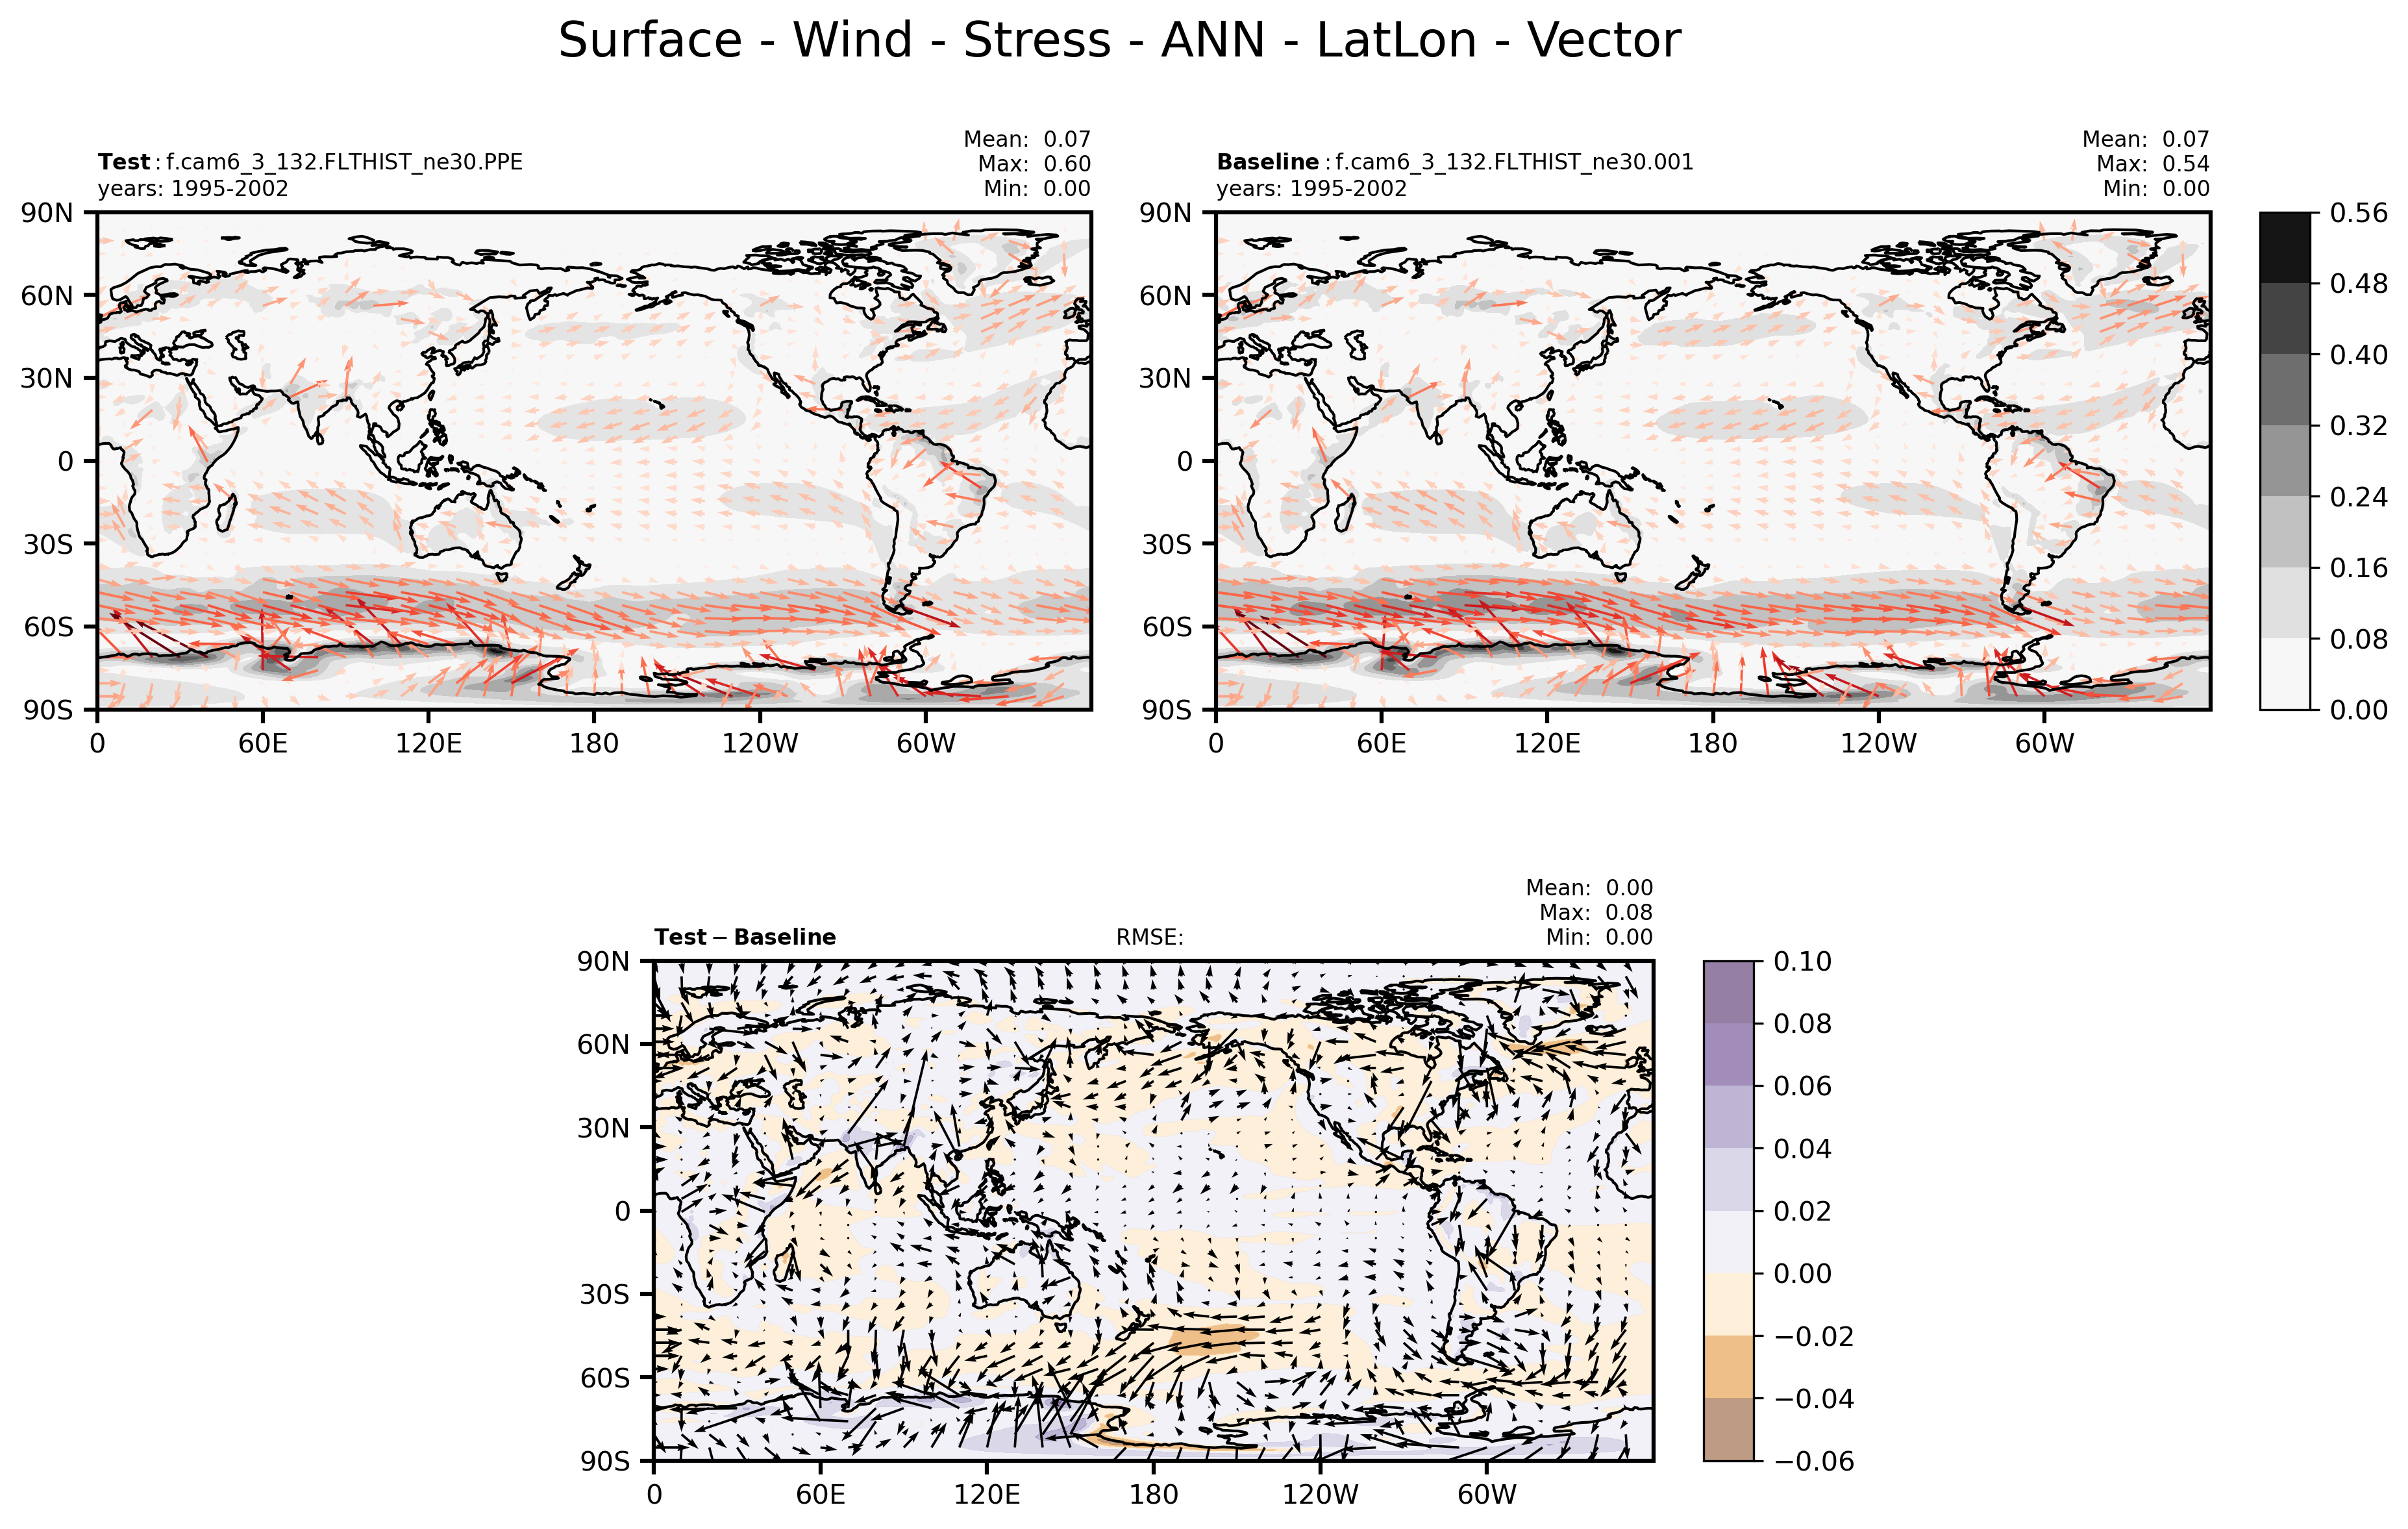
Fig. 3 Here is my figure caption!#
Zonal plots#
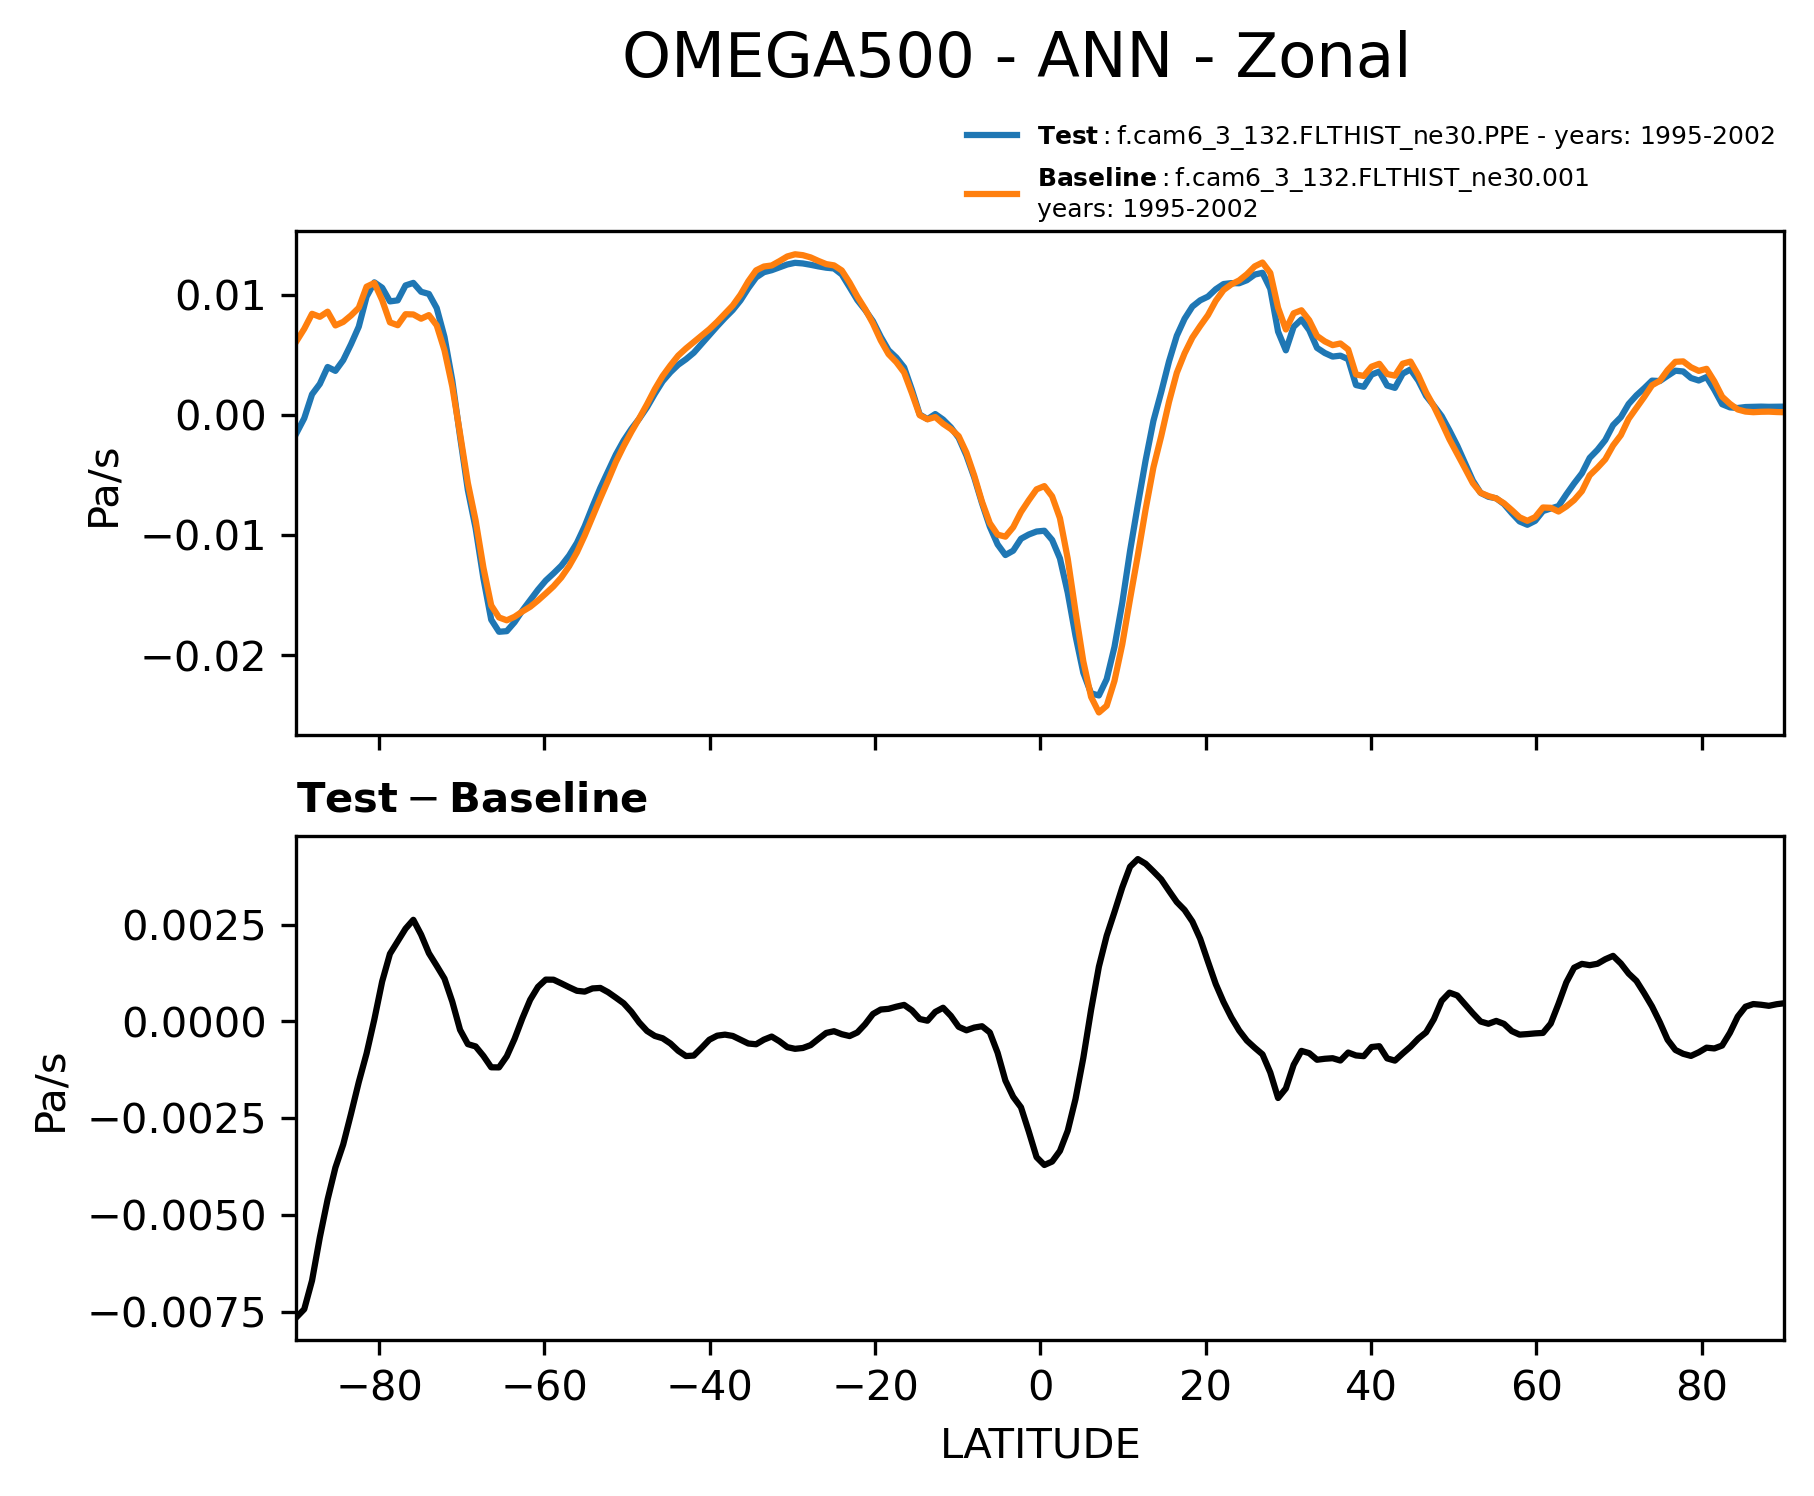
Fig. 4 Here is my figure caption!#
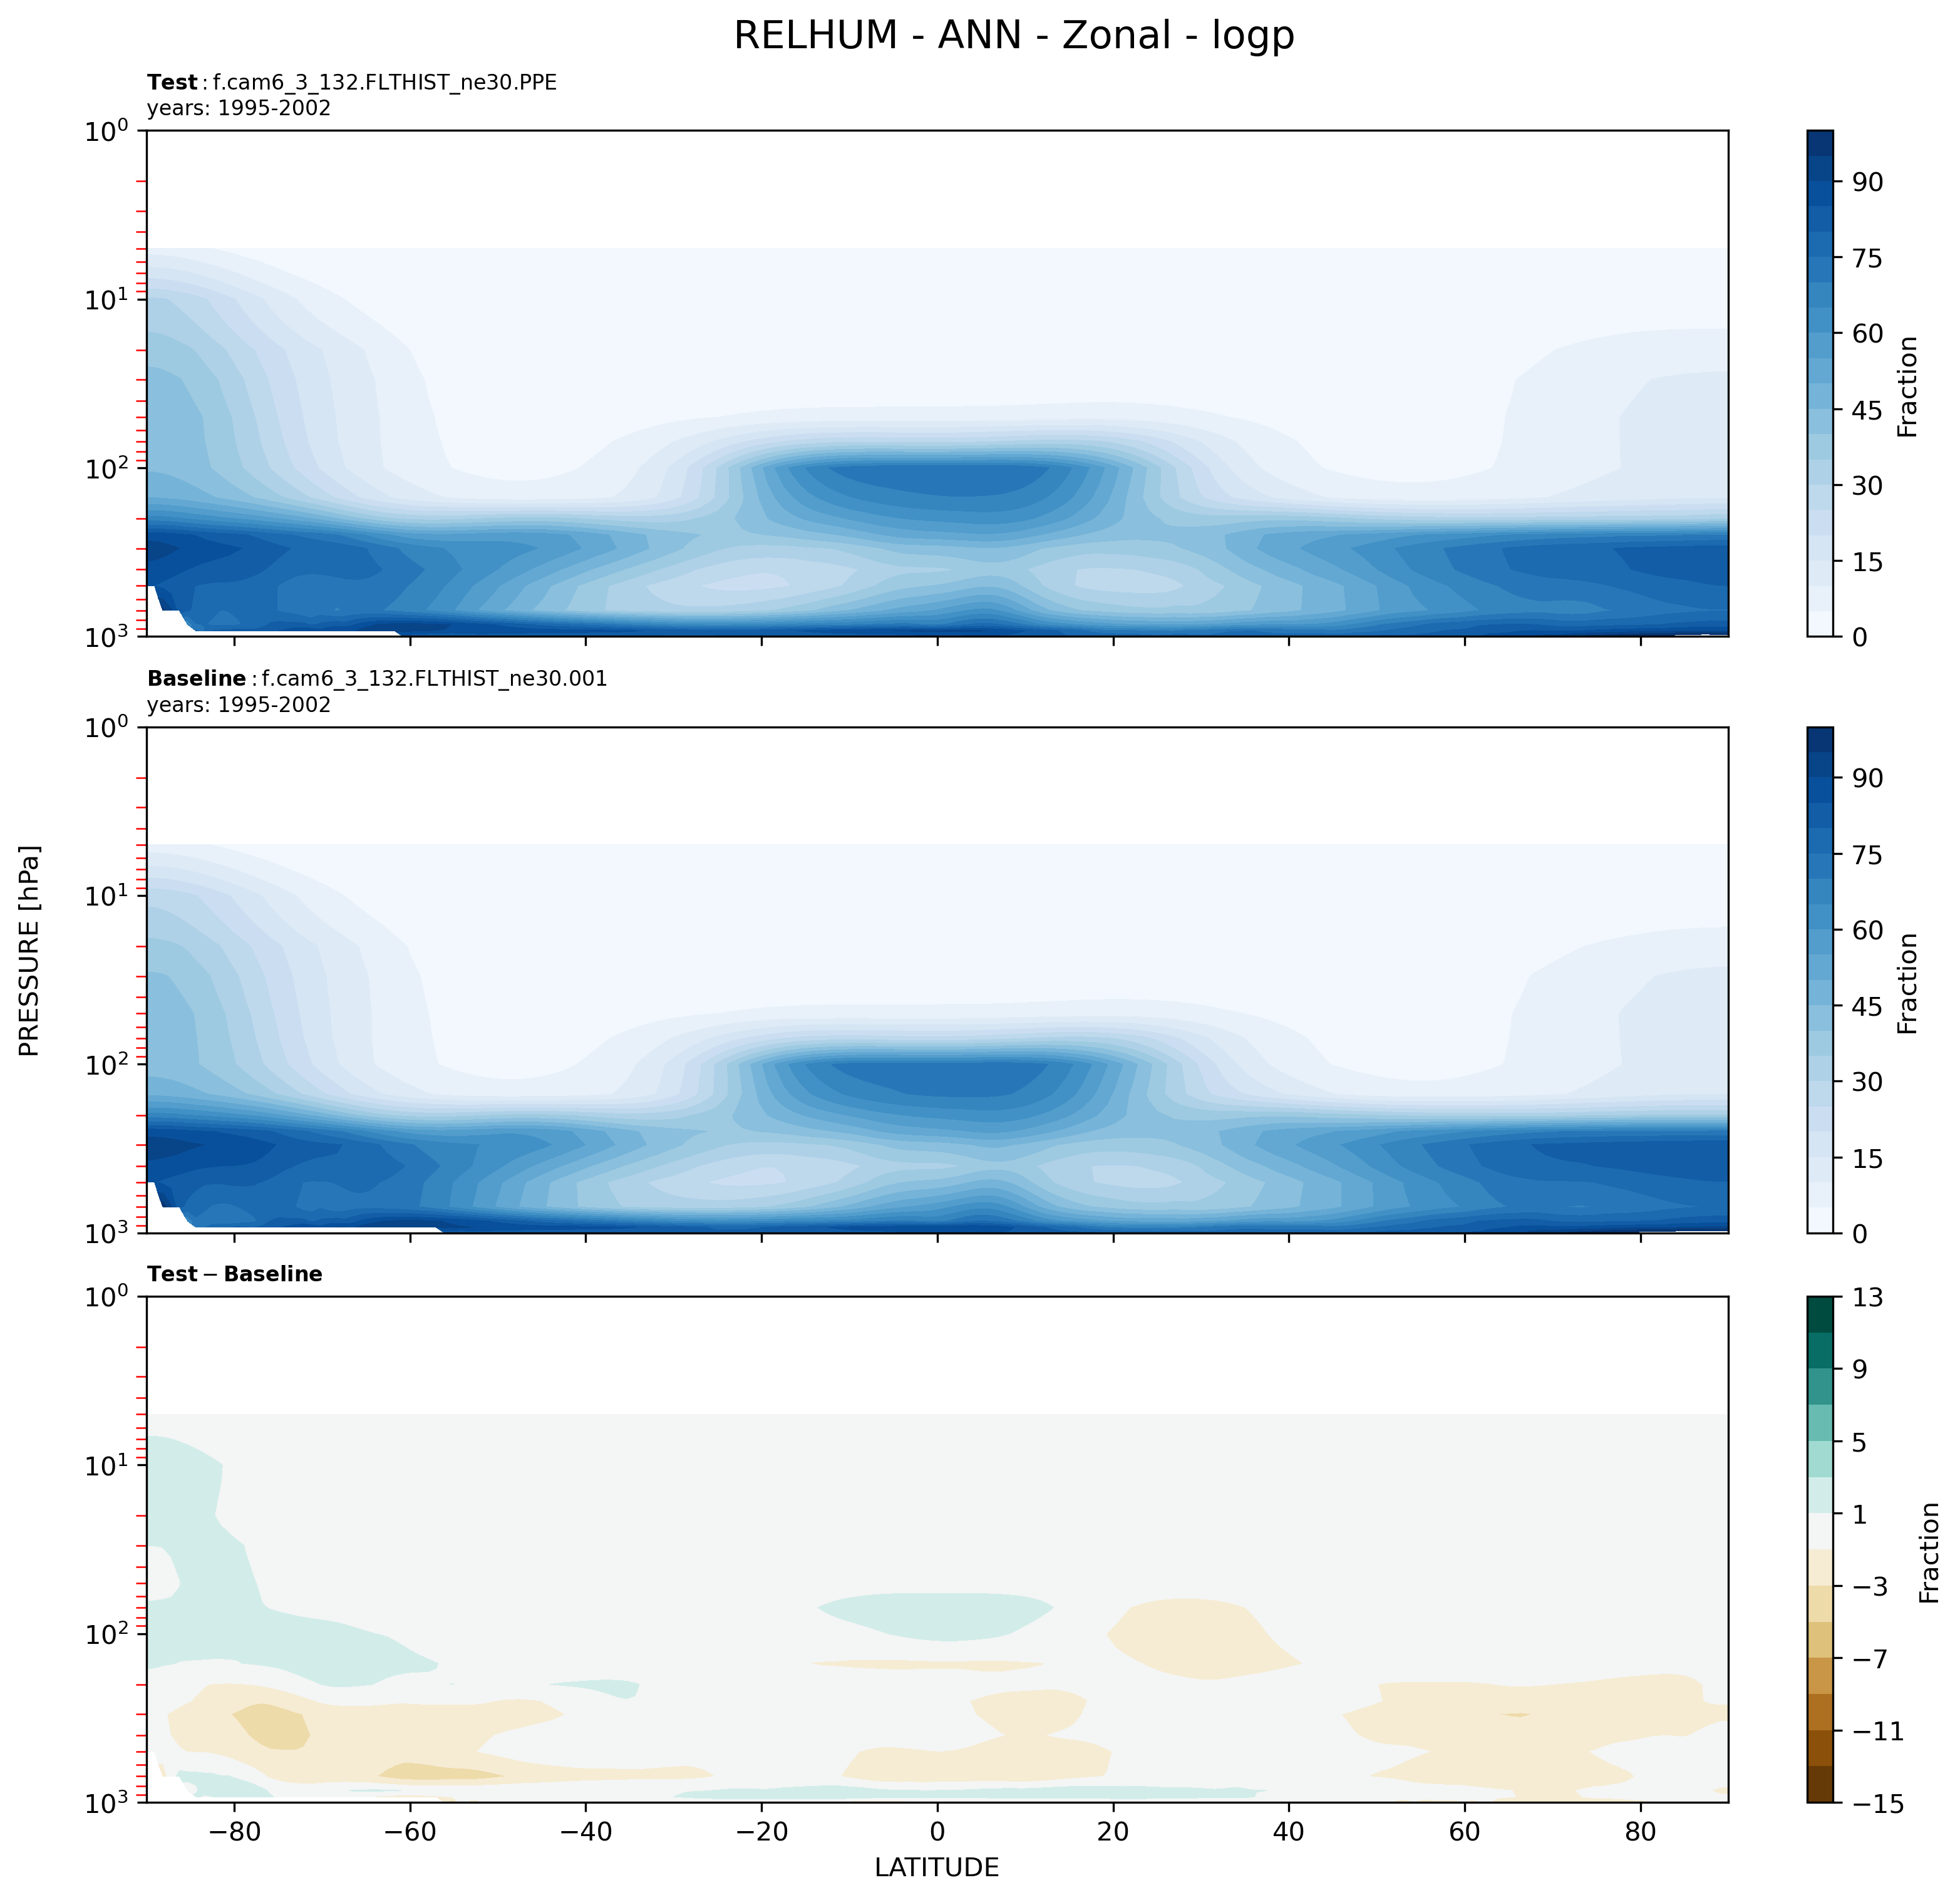
Fig. 5 Here is my figure caption!#
Meridional plots#
Fig. 6 Here is my figure caption!#
SH and NH polar plots#
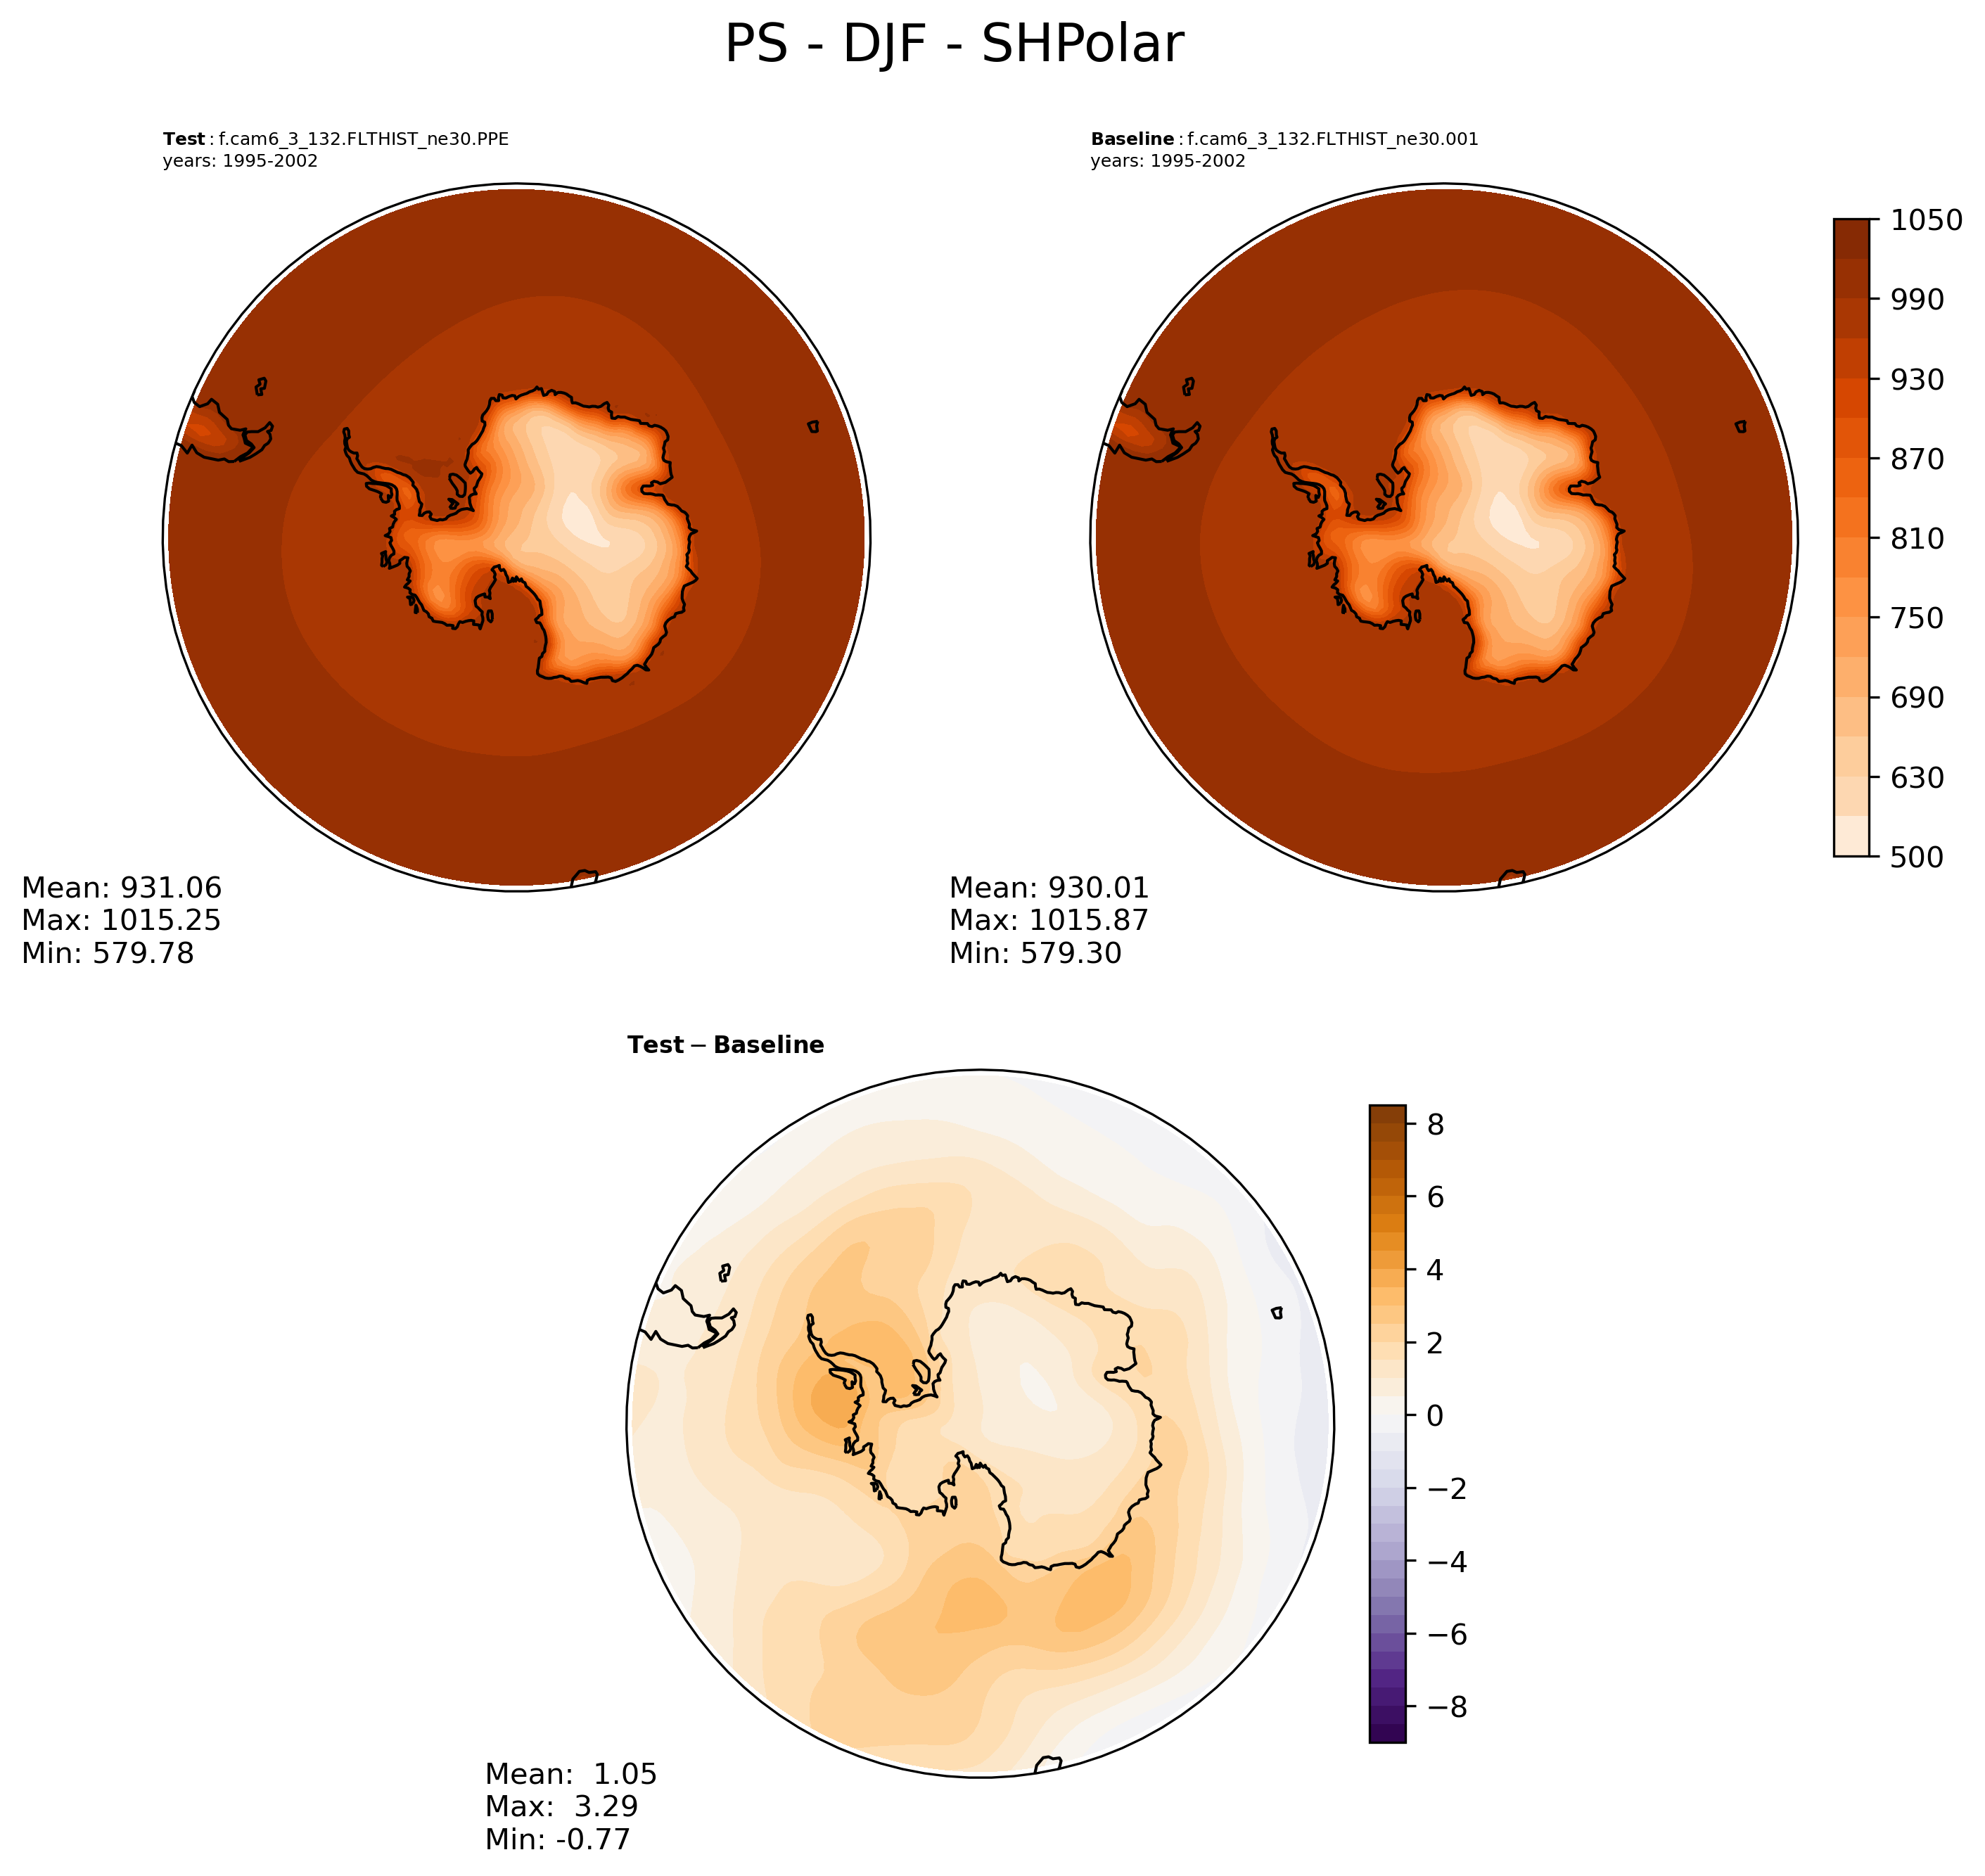
Fig. 7 Here is my figure caption!#
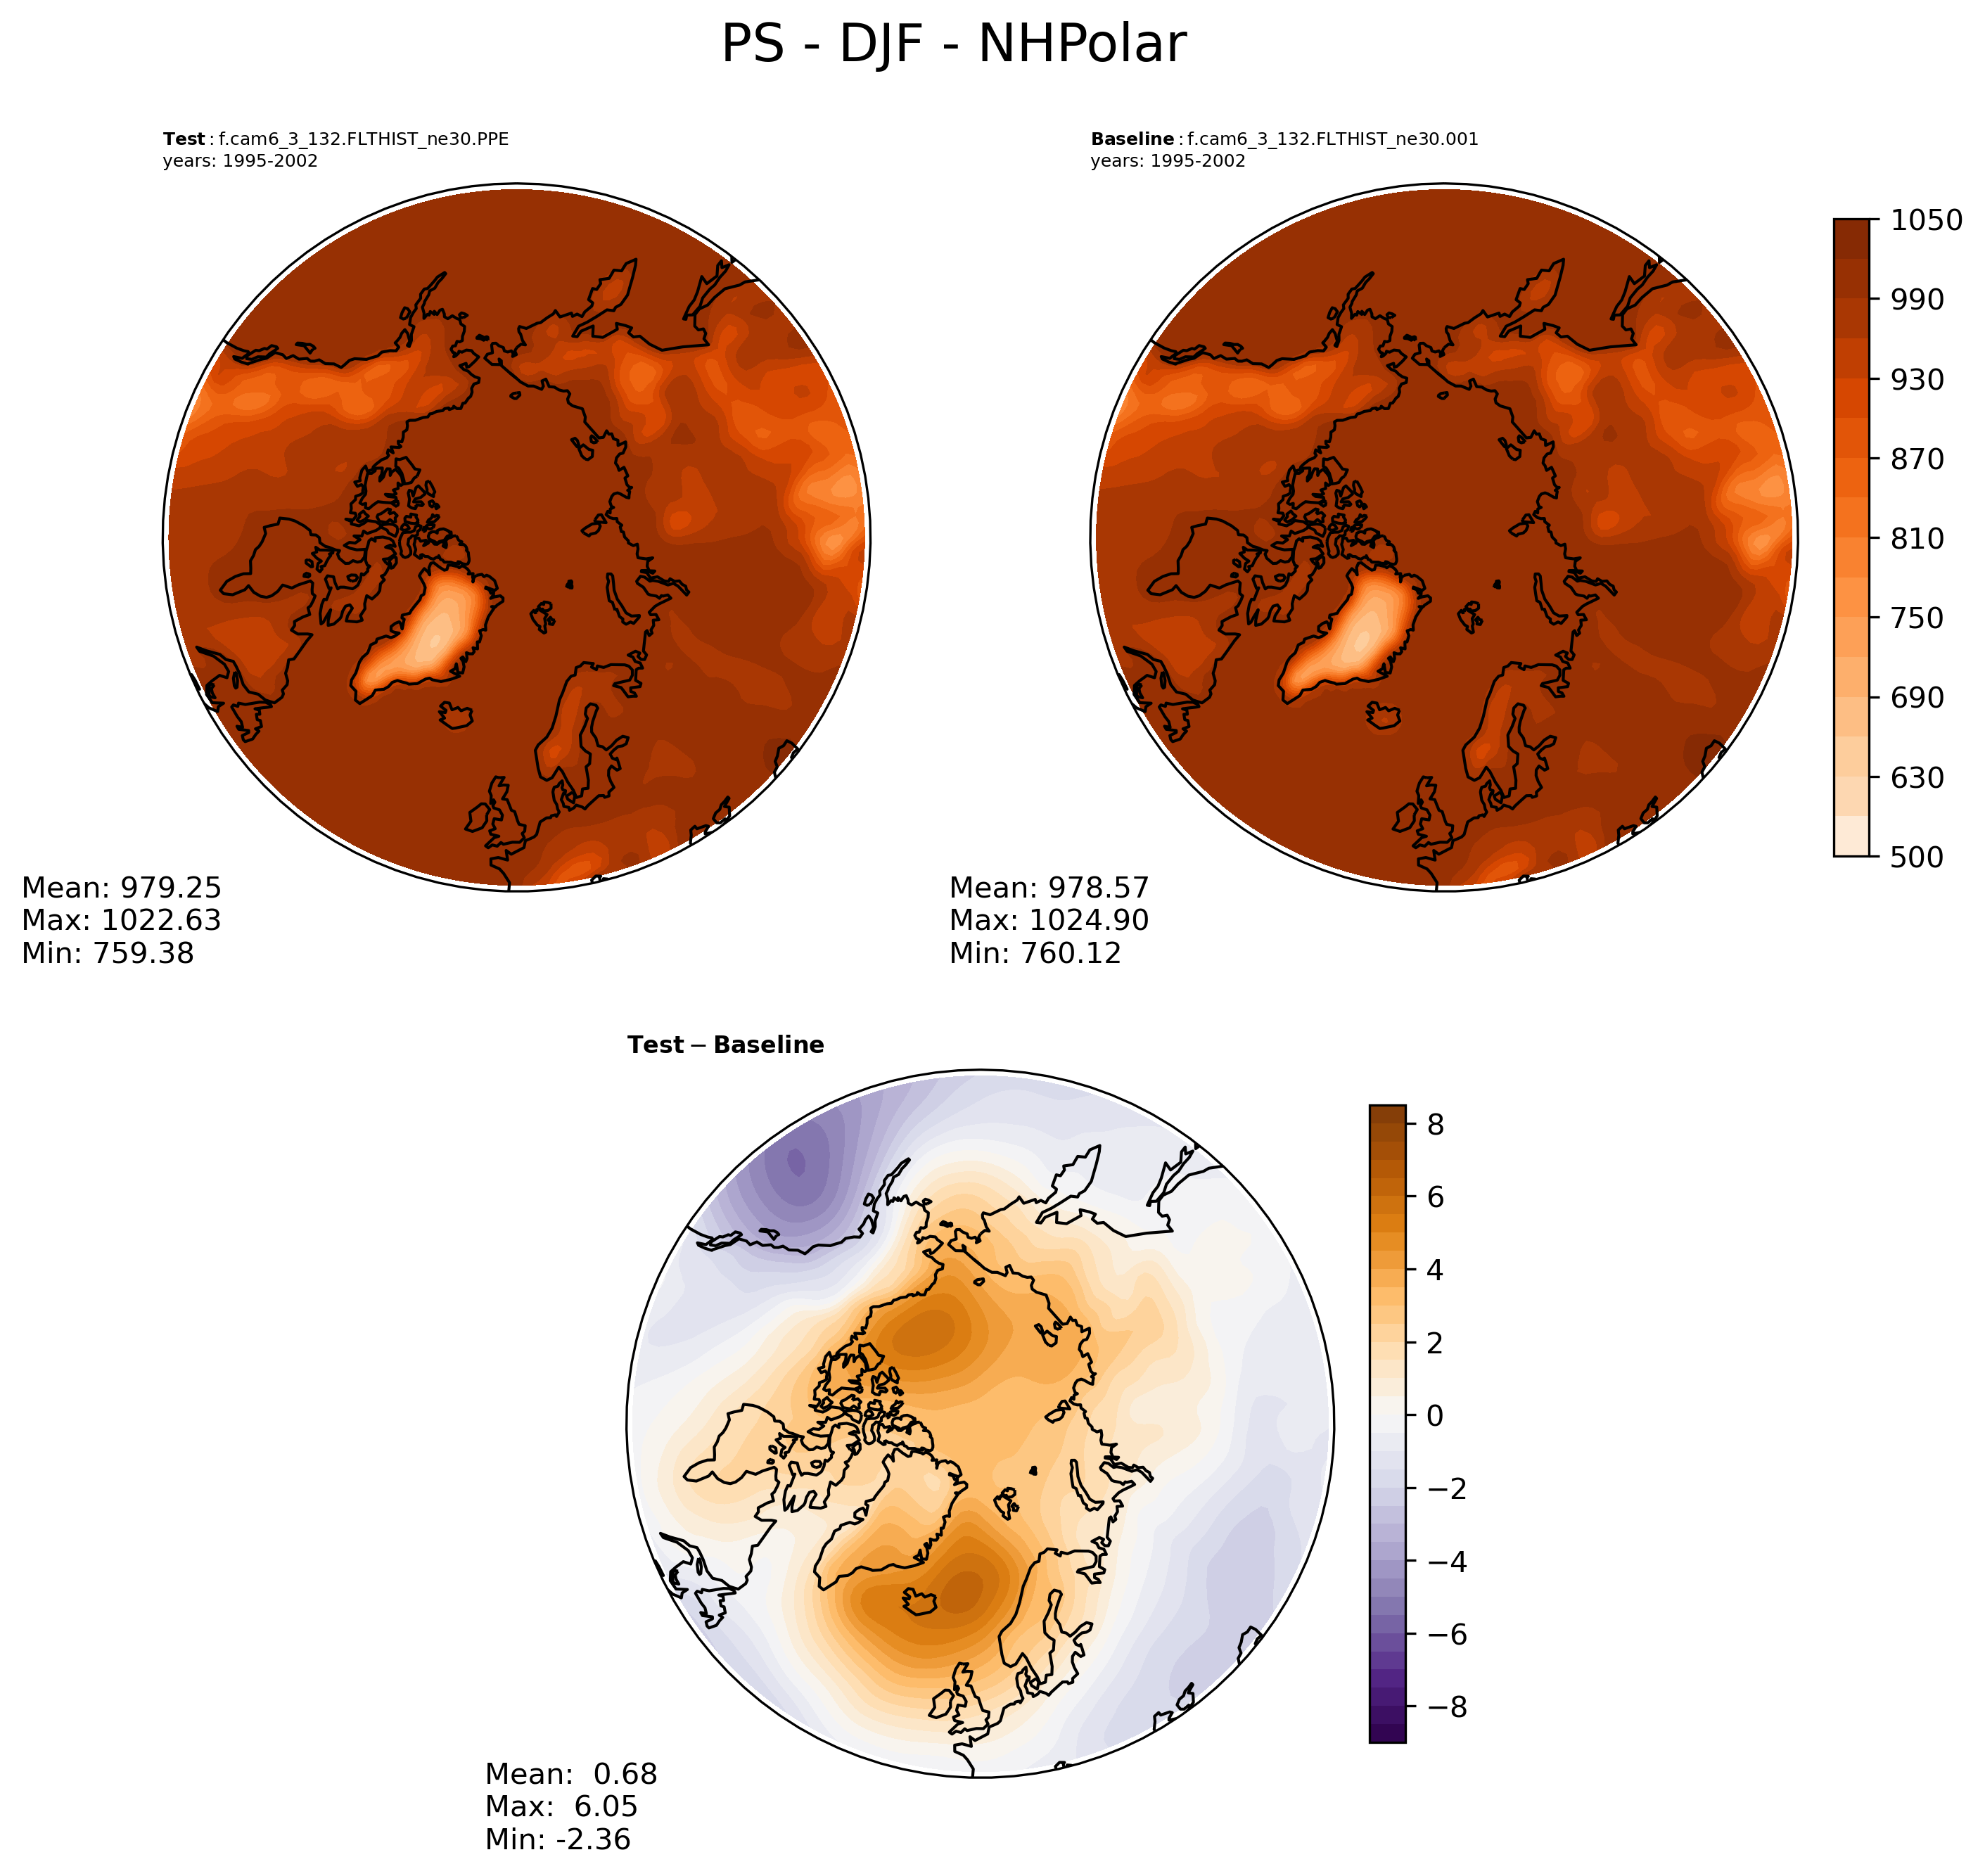
Fig. 8 Here is my figure caption!#
Quasi-Biaennial Oscillation (QBO) plots#
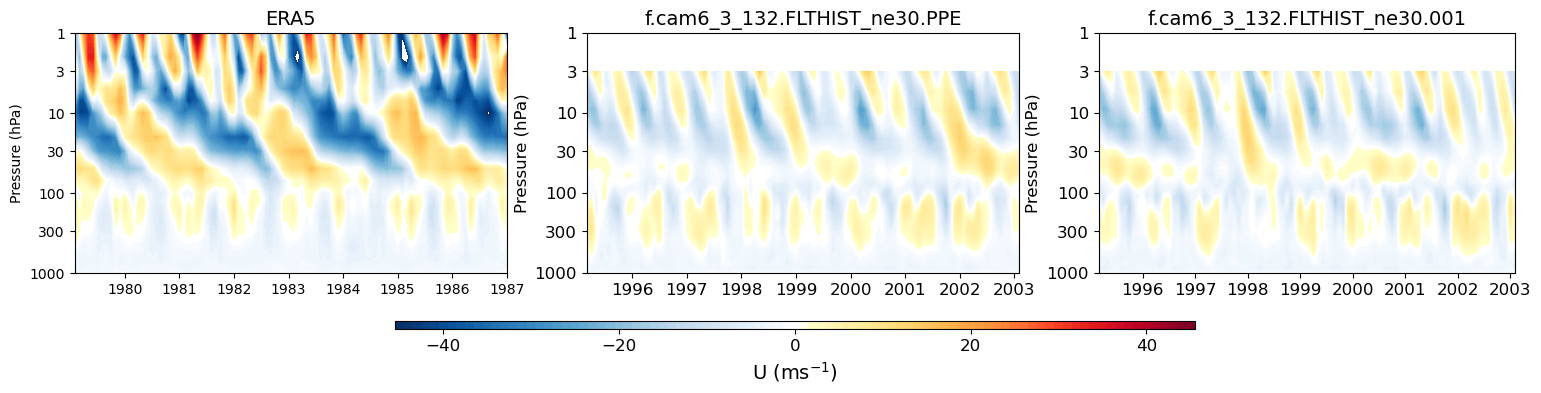
Fig. 9 Here is my figure caption!#
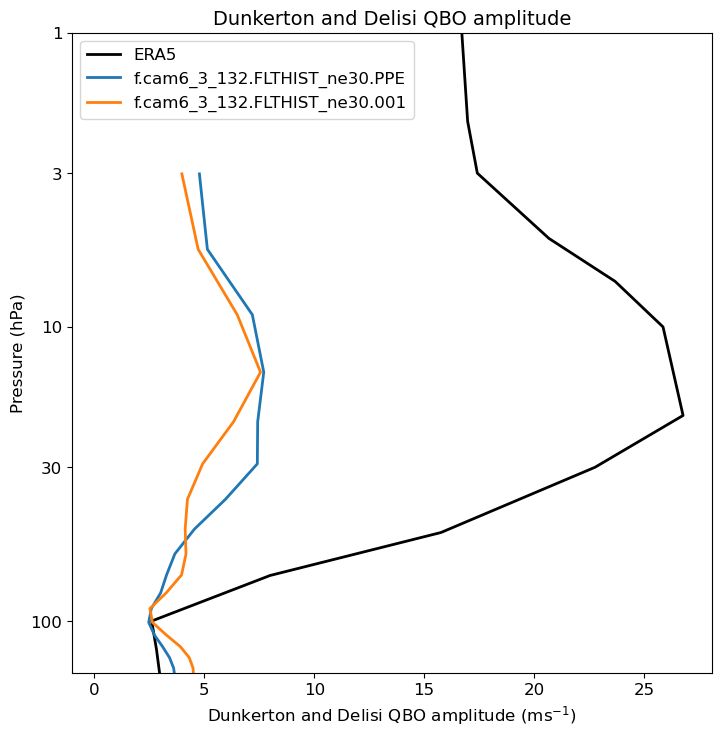
Fig. 10 Here is my figure caption!#
Taylor diagrams#
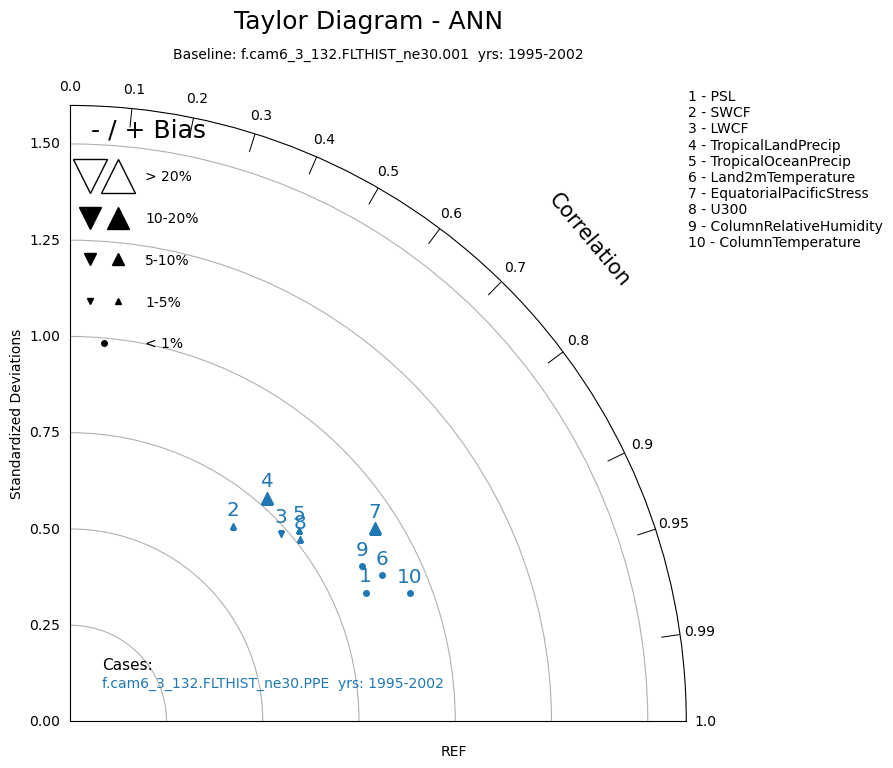
Fig. 11 Here is my figure caption!#
Tape Recorder plots of Q#

Fig. 12 Here is my figure caption!#
Your custom plots!#
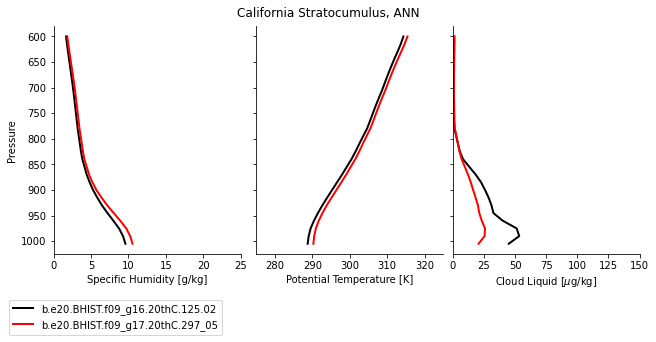
Fig. 13 Here is my figure caption!#
Website Generation#
Host your diagnostics to a webpage for easy viewing of plots!
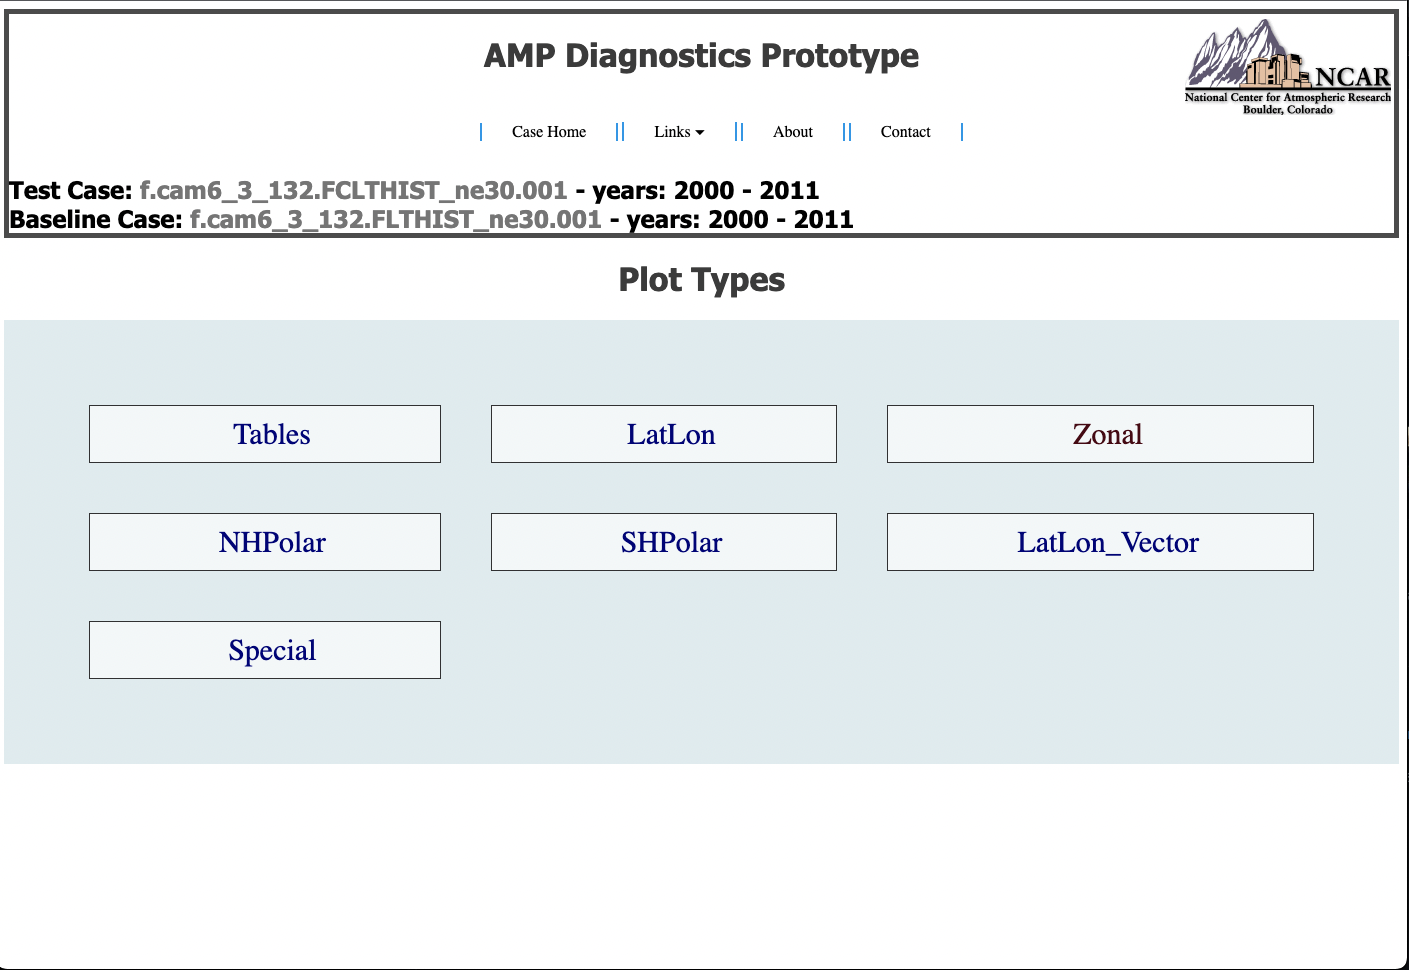
Fig. 14 Here is my figure caption!#
This was a quick intro to the ADF, please refer to the reference section for detailed information for each part of the ADF!